(1) Read the pdb or cif file into PyMOL. The pLDDT values are stored in the B-factor column.
(2) Show the fold as cartoon and color the fold according to the pLDDT values
| Color using the spectrum command (rainbow colors) |
Color the AlphaFold way |
| reinitialize load my_AF3_prediction.cif, pdb1 hide all show cartoon, pdb1 spectrum b, rainbow_rev orient |
reinitialize load my_prediction.cif, pdb1 hide all show cartoon, pdb1 run https://raw.githubusercontent.com/cbalbin-bio/pymol-color-alphafold/master/coloraf.py coloraf pdb1 orient |
How to get an AlphaFold model
XXX
The pLDDT value quantifies the confidence of the predicted model by a residue-based metric, i.e. you can visualize, which parts of the model are predicted with confidence (high pLDDT value) and which parts of the model are predicted with uncertainty (low pLDDT value).
There are two commonly used color-coding schemes to depict the value of the pLDDT value on the protein fold.

The servers XXX specified above color-code the pLDDT confidence metric according to the scheme shown above. pLDDT values higher than 90 indicate high confidence and you can expect that they are usually close to the real structure. Regions with values between 70 and 90 might also be correct, but you can expect larger differences. Regions with values lower than 50 are ill-predicted, these are often flexible regions.
To color the cartoon representation of the predicted fold according to this scheme, use the script coloraf.py, which has been generated by Christian Balbin. You install python scripts into the session by the run command:
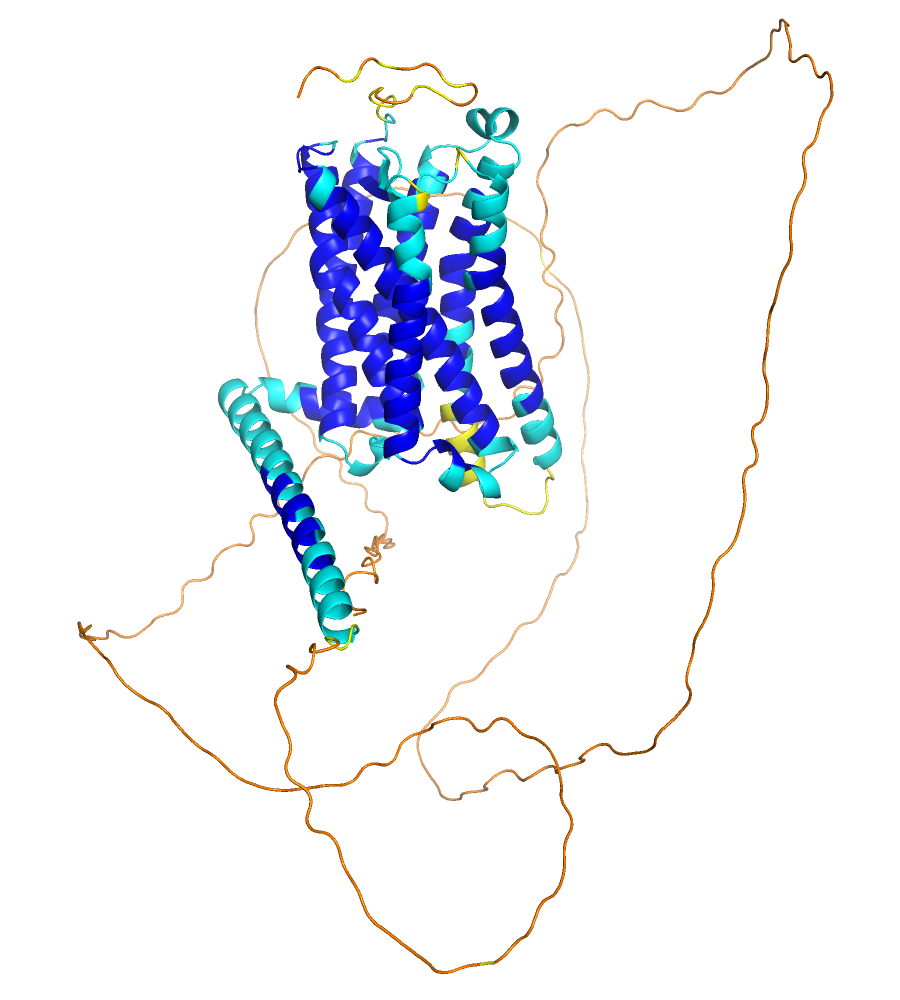
| reinitialize load AF-Q13585-F1-model_v4.pdb, pdb1 hide all bg white show cartoon, pdb1 run https://raw.githubusercontent.com/cbalbin-bio/pymol-color-alphafold/master/coloraf.py coloraf pdb1 orient; turn z, 90 The python script installs a new command named coloraf and it is used as: coloraf <selection> |
 AF model of GPR50 colored via AF scheme, click on image to enlarge |
ColabFold uses a similar color coding for the pLDDT value with a
continuous gradient: 
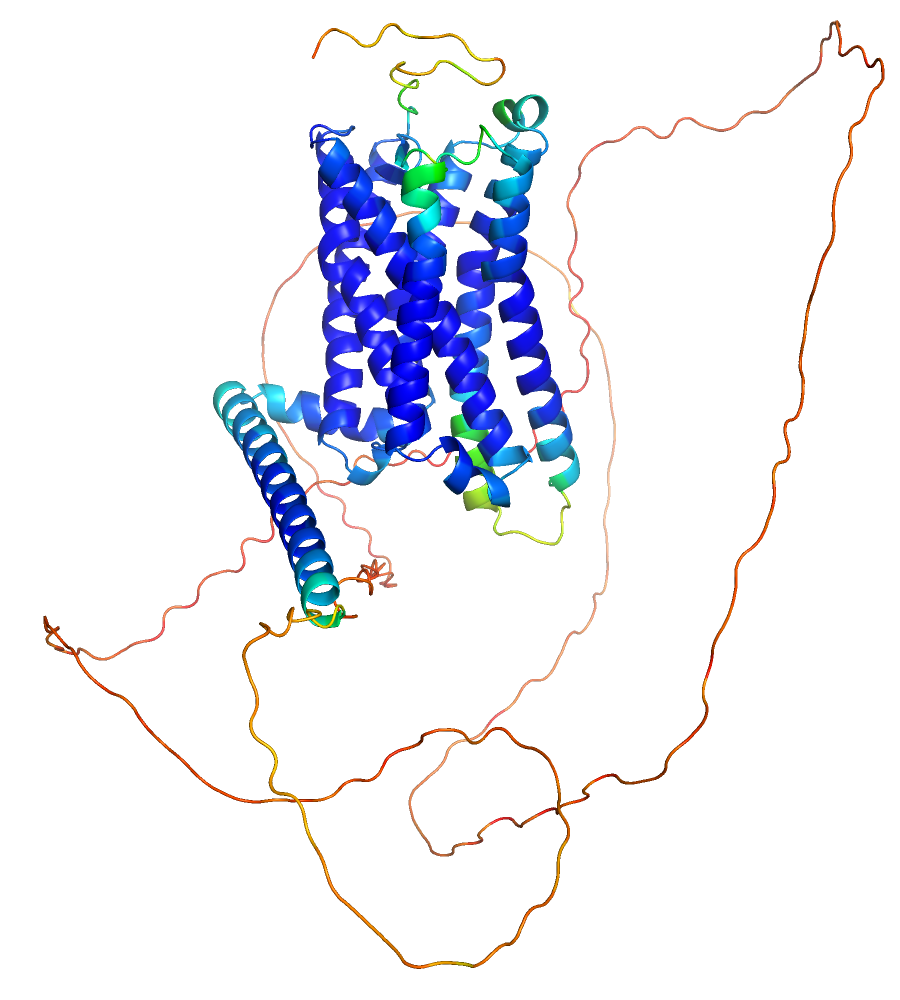
| You can generate a similar color-coding in PyMOL via the spectrum
command: reinitialize
|
 AF model of GPR50 colored via CF scheme, click on image to enlarge |
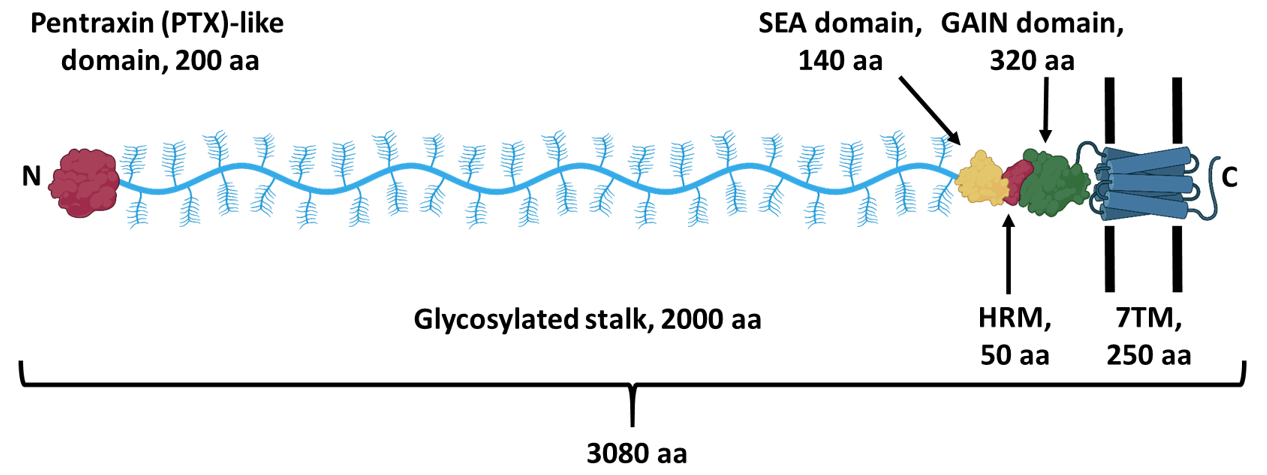
In this tutorial we display and analyze the dimer structure of a pentraxin domain in the extracellular region of the adhesion GPCR ADGRG4 (GPR112). The following scheme shows the domain structure of this receptor. A pentraxin domain is located at the very N-terminus. We crystallized this domain and determined its crystal structure. The asymmetric unit contained one protein chain. Light scattering experiments indicated a concentration-dependent formation of homodimers. Crystal packing analysis suggested several possible dimer structures. ColabFold was used to predict homodimer structures by AlphaFold2 algorithms. At the time when the prediction was generated (January 8th 2022), the coordinates of the experimental structure were not yet deposited in the protein data bank.
 |
Scheme of the structure of ADGRG4 (GPR112), an orphan adhesion GPCR. A pentraxin domain is located at the very N-terminus. A very long glycosylated stalk region connects this domain to the SEA/HRM/GAIN domains upstream of the 7TM domain of the GPCR. |
The following images show the results of the prediction.These figures are generated by the ColabFold server.

In panel A, the pLDDT score is mapped onto the dimer fold. Panel B shows the sequence coverage and panel C the predicted aligned error plot (PAE).
First, we want to generate the figure of panel A, i.e. the pLDDT values mapped onto the protein fold, in PyMOL. Download the pdb file of the rank 1 AlphaFold2 model to a suitable directory. Load the model into PyMOL. Change to a white background.
The pLDDT values are specified in the B-factor column of the pdb file. These values are between 0 and 100 and specify the confidence of the residues (or actually region) of the sequence. The PyMOL GUI has an option to color by the B values, which you activate via the OB: your_object_name C: Color, spectrum, b-factors (*/CA) option. However, as this is suitable for B-factors, high values are mapped with red color onto the fold and low values with blue color. In the figure in panel A, the reverse coloring scheme is used, as the high confidence values are more intuitively displayed in blue (cold) and the low confidence regions in red (hot, flexible). This is intuitive as the regions with low pLDDT values are often flexible (disordered, random coil) as the low confidence in predicting a fold correlates naturally with the propensity of having no fold, but it is important to note that it might as well be that the region is well folded but AlphaFold has not enough information (e.g. from many homologous sequences) to predict the fold.
 |
To map the values in the B-factor column
in many different color gradients or spectrums onto the fold, we use
the PyMOL spectrum command. Use CL:
spectrum b, rainbow_rev to achieve a coloring similar to the
one shown in panel A. Most of the fold is predicted with high confidence (high pLDDT values, blue). Only a longer loop has low confidence. Using a pml script, this image can be created via: load hsG4dimer_a13c4_unrelaxed_rank_1_model_2.pdb, pdb1 set bg_rgb, white dss spectrum b, rainbow_rev show cartoon util.performance(0) orient turn x, 110 clip slab, 50 |
Next, we want to superpose the predicted dimer structure with the experimental dimer structure. The X-ray crystal structure of the pentraxin domain of GPR112 is deposited in the protein data bank. Determine the pdb id by entering "GPR112" in the search field. Download the structure into pymol. One protein chain is displayed as, which is the content of the asymmetric unit of the crystal. To compare the predicted and experimentally determined protein folds, the structures have to be superimposed. Since we want to generated the experimental dimer in the next step, we need to superimpose the AlphaFold model onto the experimental structure. Use the command OB: <your_object_name_of_predicted_structure> A: Action, align, to molecule (*/CA), 8b55. This will align one of the two protomers of the predicted dimer to the protein chain A of the experimental structure. (Alternatively use the align command: align mobile and name CA, reference and name CA).
You will notice that the structures superimpose closely, in particular the regions that have low pLDDT values (blue). Analyze the regions which have larger pLDDT values. Indeed, larger deviations are observed here to the X-ray structure. Check the experimental structure of the long loop with very low pLDDT values that protrudes from the structure.
 |
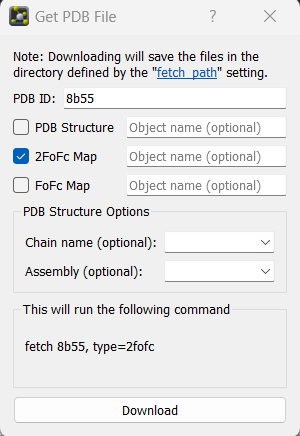
This loop is missing in the X-ray model.To analyze this further, check the electron density maps of the model. Load the structure factors via Menu: File, Open... . Use the options indicated in the menu shown left to load the 2Fo-Fc map. After the structure factors have been loaded, a new object named 8b55_2fofc is shown in the objects menu, but the density is not yet displayed. To display the density use OB: 8b55_2fofc A: Action, mesh, @ level 1.0. The electron density map is now displayed in white color and thus not well visible, if the background is white. Therefore, color the new mesh object in gray. Center on a residue at the near the beginning or end of the loop. Reduce the slab to have a good view on the local region. Display all residues as sticks. Check the quality of the electron density map of the folded part compared to the loop region. |
To compare the experimental and predicted dimer structures we need to generate the symmetry mates of the protein chain of the asymmetric unit. The symmetry information is part of the pdb file and PyMOL can use this to generate symmetry-related copies of the contents of the asymmetric unit. First hide the stick representation of 8b55. Next, use OB: 8b55 A: Action, generate, symmetry mates, within 4 A. This will generate all symmetry-related chains that have 4 Angstroms or less distance to the chain in the asymmetric unit. The symmetry mates appear as individual objects. Check, which one corresponds to the predicted dimer and delete the other objects (symmetry mates).
Back to PyMOL tutorial main page.