

Figure: Recent PyMOL version of Schrodinger.
Most functions are available via the Menu bar. In the following descriptions, the abbreviation "Menu:" indicates that a command is found here.
The Command buttons provide quick access to a few, often used commands, that often require no further input. The most important one is probably the "Get View" command, if you work via pml script files.
In the Command line you type the PyMOL commands.
The text output of commands, scripts and also some of the Menu actions is written to the Output window.
The Display area shows the current molecule. You will control the view of the molecule mostly using the mouse.
The Object buttons provide means to change the representation of the objects or apply other actions to an object.
The Mouse controls indicate which actions are available via the mouse.
In the following, the main options to generate images will be introduced via an example to walk through.
You most likely either load a pdb or cif file (my_structure.pdb or my_structure.cif) from a file using the Menu: File, Open... option or you import the structure directly from the protein data bank via Menu: File, Get PDB ... In our example we download the structure 4eiy by typing this pdb id (unique identifier of a structure in the protein data bank) into the input field.
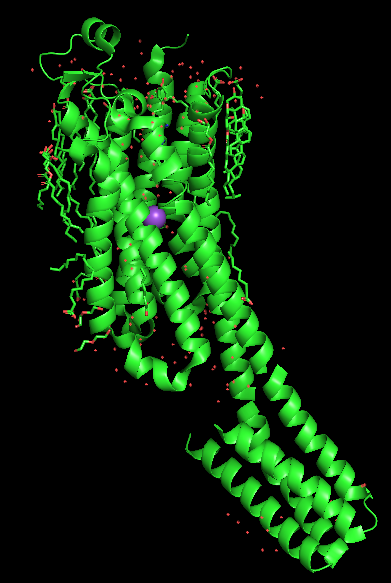
If you use a recent Schrodinger PyMOL version, the structure is displayed in a green cartoon representation and a bound ligand and lipids are depicted as sticks and a sodium ion is shown as a large sphere.
Unless you are a frog, the PyMOL green probably doesn't meet your standards for an aesthetically pleasing image. Since the initial representation obtained after loading of the structure may depend on the PyMOL version and is not predictable for other structures, we want to start from scratch and first delete the default auto-load representation: OB 4eiy: H (Hide): everything.
 |
Object buttons: The buttons on
the very left are labeled by the object names (or
named selections if in brackets). After loading of the pdb
file 4eiy, PyMOL created a molecule object with this name. If you
click on this button you toggle the molecule display on and
off. The little square buttons next to the object button can be used
to modify the representation of the molecule object or to apply
commands ("actions") to this object. The characters "ASHLC" stand
for the following options: A = Action: Apply commands acting on this object S = Show: Choose representations (cartoon, sticks, ...) for the object (i.e. molecule) H = Hide: Remove certain representations for the object L = Label: Add text labels to the object C = Color: Choose colors for the object |
Next, we list the most important commands and representations available via these object buttons.
 |
First the A = Actions button.
It is fine if you skip this step, we will come back to these
commands when needed and I rarely use them.
|
 |
 |
Before we have a look at
the different representations available in PyMOL, we should be aware
what the structure 4eiy contains and how it is represented by PyMOL
after loading. 4eiy is a crystal structure of the A2A adenosine receptor, a GPCR. The structure has been determined at a fairly high resolution of 1.8 Angstroms. Shown are:
We will use this structure as a GPCR example to study various typical representations of a protein structure. Next, we have a short look at all representation types that are available via the Object buttons "S" Show button. First hide the default representation by choosing OB: "H" Hide, everything at the 4eiy object (or at "all"). |
Activate the representations one after the other via the OB: "S" Show options. Sometimes it is preferable to hide the previous representation via OB: "H" Hide everything or to hide only a certain representation style. But some representations also go well together, as indicated in the following.
 |
 |
 |
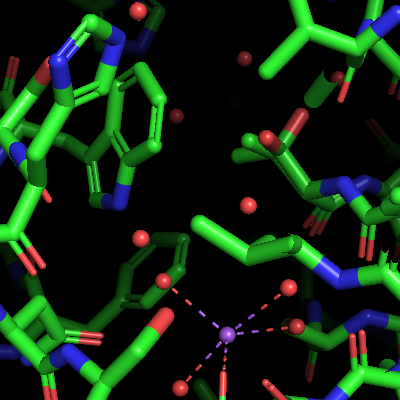 |
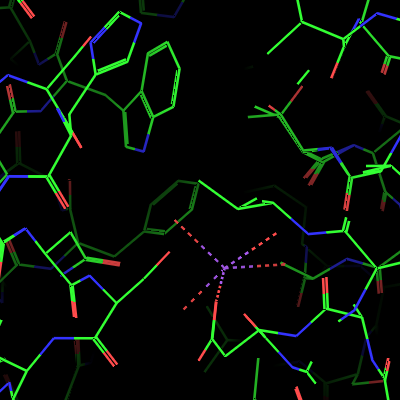
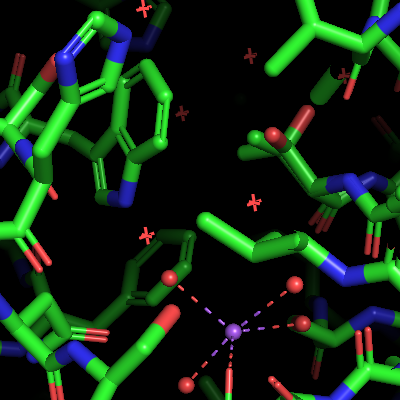
| OB: "S" Show lines: Bonds are represented as lines, double bonds or aromatic systems are indicated. The coordination bonds of the sodium ion are also shown. The water molecules and the sodium ion as monoatomic residues are not shown, therefore some coordination bonds end at the not visible Na+ ions and water molecules. This representation is mostly used for analyzing the structure, it is not suitable for publication-quality figures. | Next, OB: "S" Show nonbonded is activated in addition to the lines. Now the water molecules are shown as little red crosses. However, the metal ions and the metal-coordinated waters are not shown, probably as they are considered as bonded. | Next, activate the OB: "S" Show sticks option on the 4eiy object. This representation shows all bonds as sticks. The coordination bonds are represented as thinner broken sticks (but not lines) and the sodium ion and the coordinated oxygen atoms are represented as spheres with the same radius as the radius of the covalent bonds. The "non-bonded" water molecules are not represented in stick mode. | Next, activate OB: "S" Show nb_spheres on 4eiy. The nb_spheres option shows non-bonded atoms as spheres. The lines and nonbonded representations are now hidden behind the larger sticks and nb_spheres representations. This causes no problems here, but should generally be avoided. |
Further representations of the OB: "S" Show... menu are the following.
 |
 |
 |
 |
|
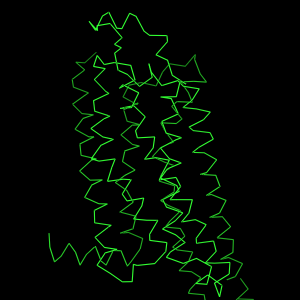
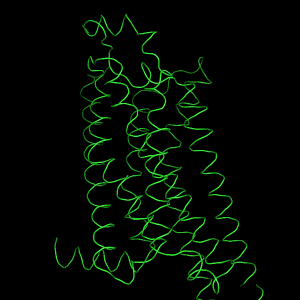
| The OB:"S" Show ribbon representation is actually better known as a Cα-plot, as it shows the Cα atoms connected by straight lines. The word "ribbon" is otherwise also often used to describe the PyMOL cartoon representation. As you notice, the Cα-plot is not a very beautiful type of representation. It is most often used in superpositions to show how similar folds are. The is only obtained if ribbon_sampling = 1 (set ribbon_sampling, 1). | However, the OB:"S" Show ribbon option may also result in
the representation shown above, which looks as if the whole fold is
represented like a loop. This may be achieved via the M:
Display, Quality, Maximum Quality option, which sets the
parameter ribbon_sampling from 1 (Cα-trace) to 10,
among other parameter changes (listed to the Output window). |
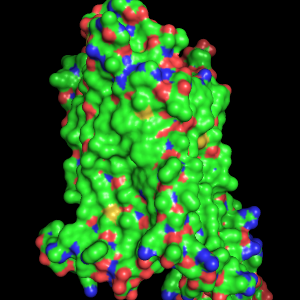
The next image is a typical cartoon representation of a protein fold as α-helices and β-strands connected by loops. Our GPCR structure, however, has no β-sheets. This representation is obtained via the OB: "S" Show cartoon option. | The OB: "S" Show surface option shows the molecular surface of the protein. The atom colors are mapped onto the surface, or, to say it the other way around, the surface is colored according to the color of nearby atoms. This does not make much sense here, but we can change the surface color later. |
We will discuss some labeling options later by commands, therefore
labeling via the object buttons (OB; "L") is not described here.
We will discuss the OB: "C" Color commands when generating different kinds
of typical molecular images.
Back to PyMOL tutorial main page.